Features:
Get ready to elevate your trading game with the Candle Replay Magnifier! This nifty tool allows you to:
- Overlay historical candles from any date directly onto your current chart.
- Automatically adjust the replay zone as the live chart moves.
- Access dynamic tooltips that provide:
- Time.
- Open, High, Low, Close.
- Candle Range.
- Direction (Bullish/Bearish).
- Volume.
Parameters:
| Parameter Name | Description |
|---|---|
| InpReplayDate | Set the date for fetching historical candles. |
| InpMainZoneColor | Choose a color for the main live zone rectangle. |
| InpReplayZoneColor | Set the color for the replay overlay zone. |
| InpBullColor | Pick a color for bullish replay candles. |
| InpBearColor | Choose a color for bearish replay candles. |
How to Use:
Follow these simple steps to get started:
- Attach the indicator to your chart (intraday works best).
- Select the Replay Date using the input panel.
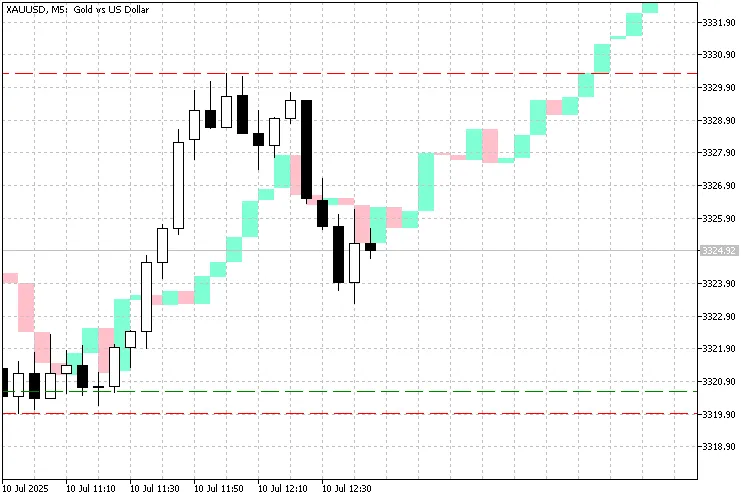
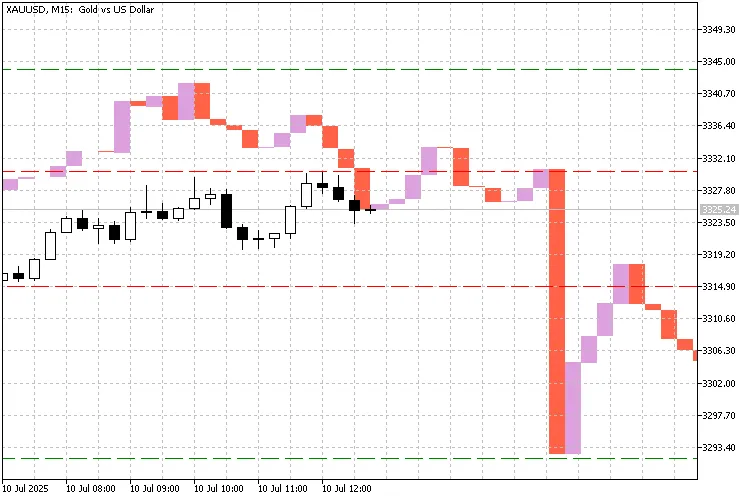
- The indicator will display a red "Main Zone" on your chart.
- A green "Replay Zone" will show historical candles aligned to the current position.
- Hover over the replay bars to view candle details.
What's Inside the Zones?
- The first candle in the Main Zone corresponds to the first candle from your selected Replay Date.
- The current live candle aligns with the last candle of the green Replay Zone.
- This setup allows you to easily analyze:
- "How did the market perform at this position last time?"
- "Are we seeing a similar pattern unfold?"
What's Around My Current Candlestick?
- The current candlestick in the red Main Zone matches the last candle in the green Replay Zone, precisely aligned by time and open price.
- The first candle on the left of the Main Zone corresponds to the first candle of the Replay Zone (from the selected date).
- The last (current) candle of the Main Zone matches the last candle from the Replay Zone, making for a seamless comparison.
- This helps you answer:
- "What did price do next the last time we were at this level and time of day?"
Notes and Limitations:
- Zone Range: Large replay ranges may slow down performance on low-end devices.
- No Wicks: Only candle bodies are displayed; upper and lower shadows are omitted.
- No Buffers: This indicator uses only chart objects (rectangles), not indicator buffers.
- Redraws on New Bar: The full replay zone is re-rendered with each new tick, which may affect performance.
- Market Closed on Replay Date: If the market was closed on the selected date, no candles will appear.
- Replay Offset Risk: If some bars are missing on the replay date, the green replay zone may misalign, affecting the current candle's open price.
- Only Intraday Timeframes Supported: This tool is specifically designed for intraday use (below daily timeframe).
Screenshots:
Conclusion: Whether you're a pattern trader, scalper, or simply want to visually compare market behavior, the Candle Replay Magnifier is a tool that adds a fresh perspective to your analysis. Give it a go and share your thoughts!


Comments 0